
You can see the subtle changes when a neighborhood is on its way up—streets get cleaner, building facades improve, new businesses start moving in. Across an entire city, however, it’s harder to track such changes, to understand in real time which neighborhoods are improving and which may need an extra boost in development.
A new tool by Harvard and MIT researchers promises to do just that, with the help of machine learning and the biggest library of urban images on the Internet: Google Street View. By using digital tools, researchers were able to assess long-held beliefs about urban improvement and offer new methods to city planners and real estate developers looking to identify areas in need of improvement.
The collaborators reveal their findings in a May 2017 paper in the Proceedings of the National Academy of Sciences, Computer Vision Uncovers Predictors of Physical Urban Change. The paper was written by Nikhil Naik, a Prize Fellow at Harvard University; Scott Duke Kominers, the Harvard Business School MBA Class of 1960 Associate Professor; Edward L. Glaeser, the Fred and Eleanor Glimp Professor of Economics at Harvard University; and MIT Media Lab professors César A. Hidalgo and Ramesh Raskar.
The team worked to see how Google Street View images taken over time could be used in urban planning. They built upon previous work done by Naik (then a PhD student at MIT’s Media Lab) with Hidalgo and Raskar to develop a computer vision method for quantifying perceived safety of street scenes. The next breakthrough came when Google released a “time machine” feature, allowing users to access historical images of areas dating back to 2007. By comparing the perceived safety in images over time, the researchers realized, they could see how and why parts of the city changed.
“It was the perfect test lab for a number of theories about urban transformation,” says Kominers, who was an intern at Google Street View when it launched 10 years ago.
Back in time
In order to evaluate the appearance of the hundreds of thousands of images, the authors used data from a crowdsourced study conducted by Hidalgo’s team in 2013. In the study, online participants were shown pairs of Street View images (chosen from a sample of several thousand) and asked to choose one of them in response to the question, “Which place looks safer?” Those pairwise comparisons were converted into ranked scores. Artificial intelligence algorithms were used to teach a computer to predict scores from image features like shapes, textures, and colors. This led to “Streetscore,” a score for perceived safety.
Next, they obtained Street View images from the same streets captured in 2007 and 2014. After algorithmically removing image pairs containing over-exposed, blurred, or occluded images, they computed “Streetchange,” the difference in Streetscores of the same blocks, seven years apart.
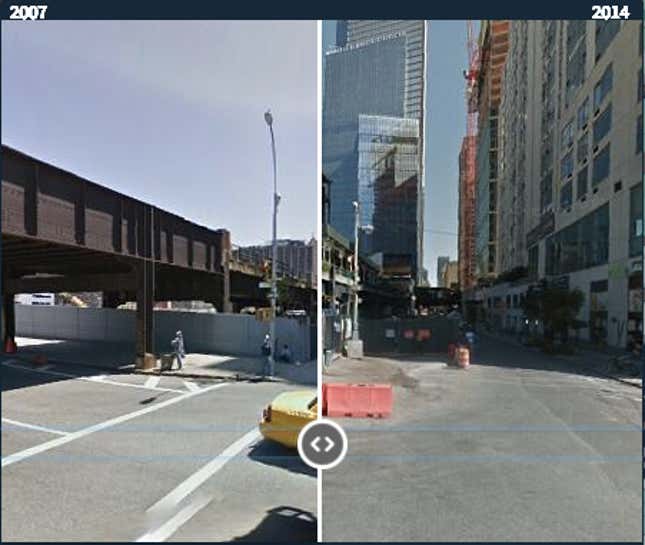
“A positive value of Streetchange is indicative of new construction or upgrades, and a negative value is indicative of overall decline of a street block,” Naik says. In validation studies conducted using crowdsourcing and municipal data from Boston, the authors found that their algorithm accurately detected how blocks changed between 2007 and 2014.
Finally, they let the computer loose on some 1.6 million images from five cities—Baltimore, Boston, Detroit, New York, and Washington, DC—to see how hundreds of thousands of street blocks changed over time. By cross-referencing the Streetchange values with other demographic data, including education, income, race, and housing costs, they could then figure out which factors mattered in development.
Surprisingly, income and housing prices had little correlation with improvement; poorer blocks were just as likely to experience physical improvements as their richer neighbors. (Such change, the authors note, is distinct from gentrification, as it measures the exterior signs of improvement, rather than changes in income level or displacement of residents over time.)
Education is a catalyst for neighborhood improvement
What did seem to matter the most were two factors: population density and education.
“The data shows support for a very classic theory of urban change: that agglomeration of human capital—having a high concentration of highly educated residents—is really important,” says Kominers. Even so, “we were surprised to find it was so much more important than other factors, such as income.”
In addition, the authors found evidence for two long-held theories of urban change: the tipping theory and the invasion theory.
The tipping theory suggests that neighborhoods that are in good shape will continue to improve at a faster rate. The researchers found that to be true in their sample, though the results were not as stark as theorists predicted. (Improvements followed a more linear, steady model rather than a more dramatic curve.)
The invasion theory, meanwhile, predicts that neighborhoods tend to improve like tipping dominoes, with nicer neighborhoods inspiring positive changes in adjacent neighborhoods. The researchers’ results clearly showed that pattern, with neighborhoods situated near physically attractive areas tending to become physically attractive themselves. It also found that neighborhoods closer to downtown business districts improved—a relatively new version of neighborhood “invasion,” as downtown living has become more attractive in recent years.
Says Kominers, “It’s always nice when your research checks out with the view outside your window.”
Research into action
While their study didn’t necessarily look at the causes of development, Kominers says it’s a fair inference that cities wanting to encourage urban development might do well to invest in education, including improving schools, college assistance, and training programs, in order to create a critical mass of educated residents.
Their study also shows that improvements tend to snowball over time, with a little investment in neighborhood development going a long way toward creating momentum not only for a particular neighborhood, but also nearby areas.
In addition to providing large-scale credence to existing theories of urban development, the researchers say their methods could be used on a more micro level to help city planners and developers pinpoint up-and-coming areas that could improve even more with a little boost, as well as in stagnating areas that could use more investment.
By picking up nuances on a street-by-street basis, the method could allow planners and developers to target efforts with much more precision.
“You could use these characteristics along with socioeconomic data to predict which areas are poised for future growth, and figure out where the next opportunity is,” says Naik.
Identifying these trends, in turn, could not only help improve individual blocks and neighborhoods, but give a boost to cities overall.
“There is a huge potential for using AI to measure not just the built environment, but also populations and urban activity,” Naik says. “Such measures will help guide business, development, and policy at hyper-local resolution, with global scope.”
This article originally appeared on Harvard Business School Working Knowledge. Sign up for the HBSWK newsletter here.